

A Discussion of Key Findings from the Latest Finance Shared Services Research Related to Top-Performing Finance Shared Service Centers
In December 2020, ScottMadden’s Brad DeMent and Trey Robinson delivered a webinar to discuss the results of the latest APQC finance shared services benchmarking study. The study was designed by ScottMadden and surveys were administered by APQC over five cycles: Spring/summer 2014; spring/summer 2015; summer/fall 2016; spring/summer 2018; and summer 2020. The scope of the finance shared services study included delivery model, scope of services, staffing, location, performance, and technologies leveraged. Results from 200 organizations from the last two cycles were shared during the webinar.
Drawing from the results of the survey, this article highlights the performance and attributes of top-performing finance Shared Service Centers (SSCs).
Access the complete article series here.
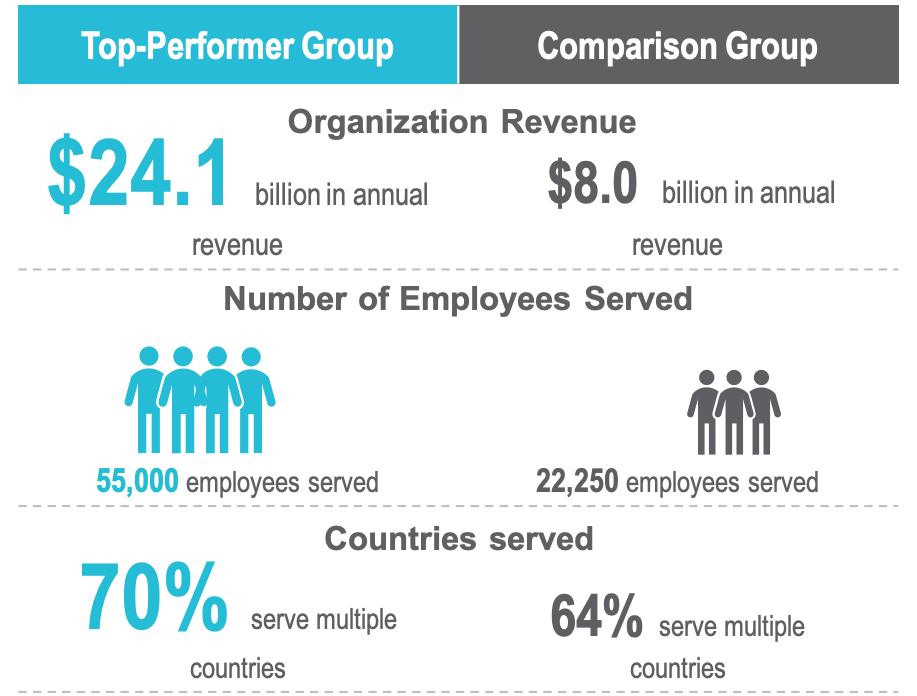
To identify top-performing SSCs, ScottMadden looked at 15 KPIs related to areas like staffing, efficiency, and cost. Organizations identified as ‘top performers’ scored among the top quartile for each KPI. Relative to the comparison group (the other three quartiles) top performers generally have:
- Greater organizational annual revenue;
- more employees; and
- slightly broader global coverage (Figure 1).
Figure 1: Broad Characteristics: Top-performer Group vs. Comparison Group (Median)
Top-Performer Analysis
The following analysis contrasts top performers with the comparison group across staffing, cost, and efficiency metrics. ScottMadden found that top performers consistently outpace the comparison group to run more productive, more efficient, and less expensive SSCs.
STAFFING METRICS
Top performers have significantly better staffing ratios than the comparison group. For example, these organizations have a median of 42.2 finance function FTEs across the entire organization per $1 billion revenue, while the comparison group has more than twice the number of finance FTEs (86.3). Breaking down staffing ratios across key finance processes shows similar efficiencies relative to the comparison group (Figure 2).
Figure 2: Number of FTEs that Perform the Following Processes per $1 Billion Revenue (Median)
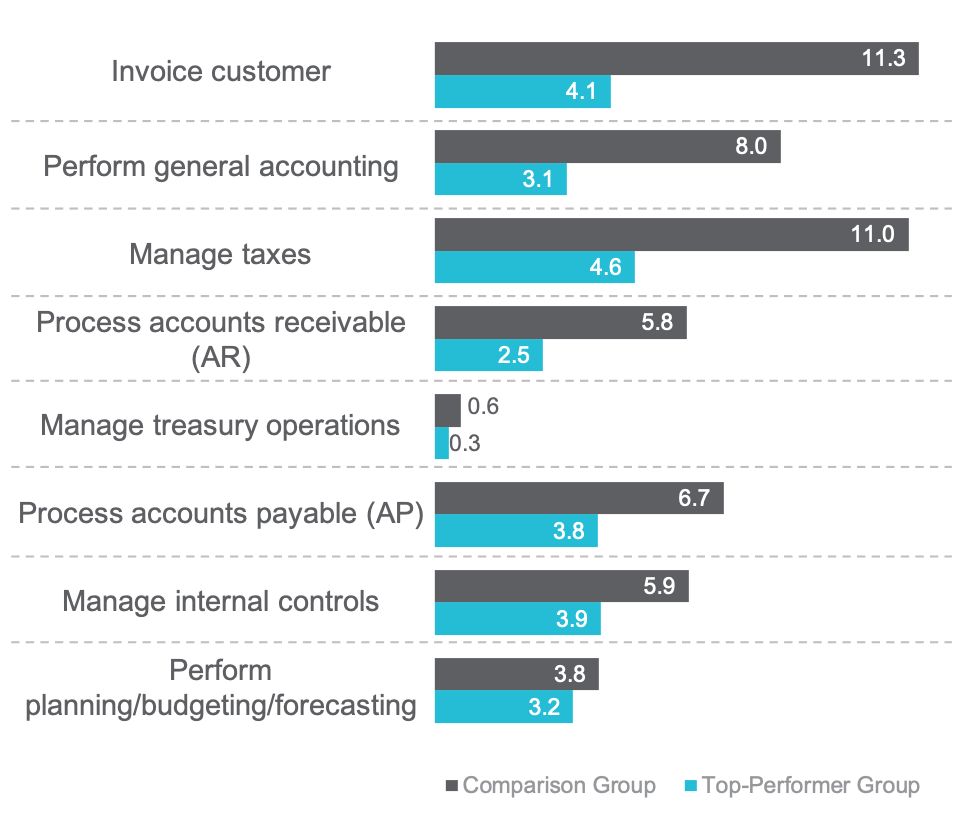
The differences between top performers and the comparison group are most pronounced in transactional processes like invoicing and general accounting, where top performers are more than twice as efficient. The gap is smaller for accounts payable (AP), where top performers are less than twice as efficient as the comparison group. Robinson noted that AP is often one of the first processes targeted for improvement within SSCs, so it makes sense that the gap is not as wide. Other processes like invoicing tend to come later in the maturity cycle, which means top performers are more likely to have optimized the process.
COST METRICS
Top performers operate at a larger cost advantage, both for the finance function overall and within SSCs specifically. For example, top performers spend $6.94 per $1,000 revenue on the finance function overall, which is slightly more than half of what the comparison group pays ($12.83) and below the median cost of $10 per $1,000 revenue. Top performers also operate SSCs at half the cost of the comparison group and nearly half the cost of the median for all organizations (Figure 3).
Figure 3: Total Cost to Operate the Finance Shared Service Center(s) per $1,000 Revenue
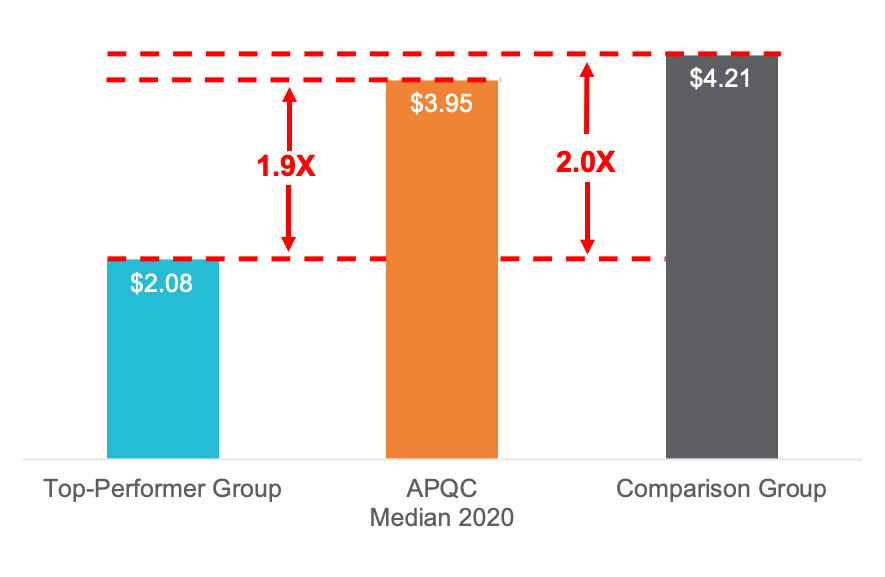
Robinson noted that the cost advantages achieved by top performers are “not just a play of moving to low-cost countries to deliver services.” Instead, these organizations largely achieve savings through higher staff efficiency and investments in technology.
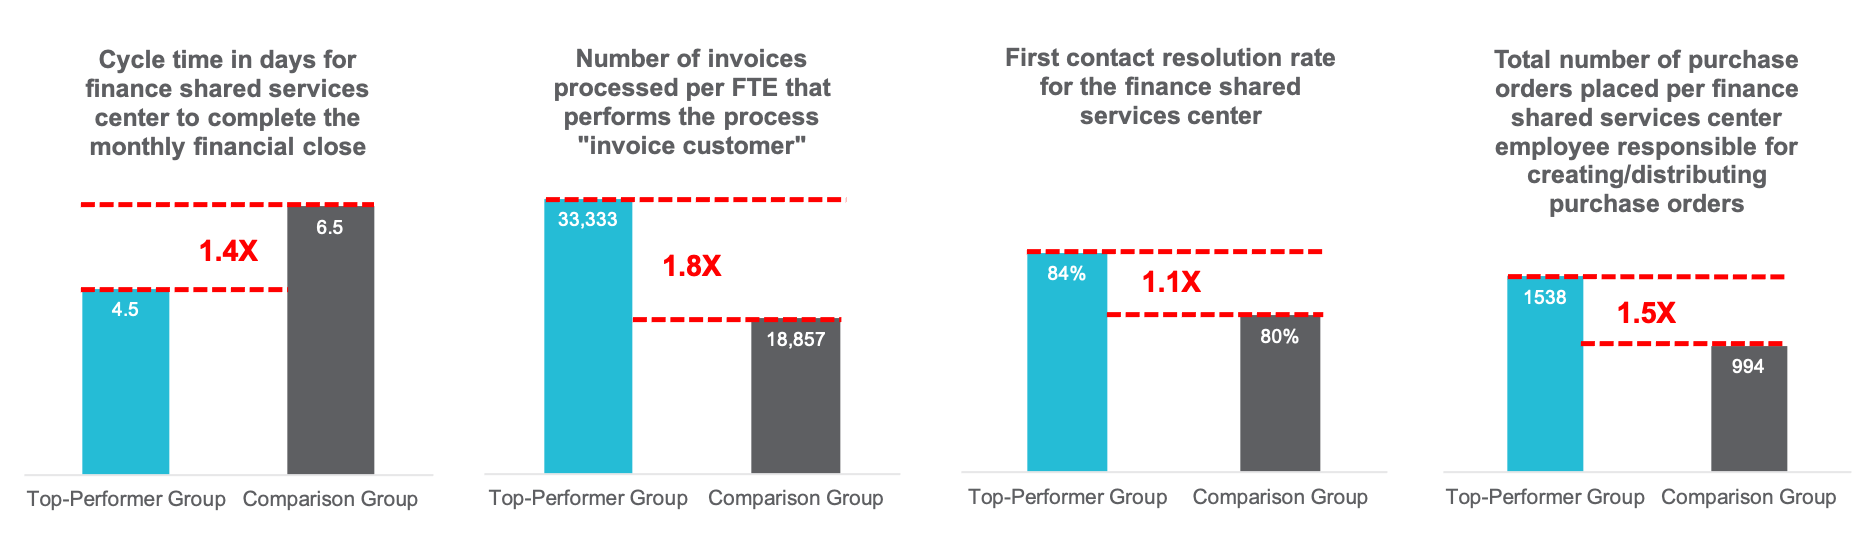
EFFICIENCY METRICS
Top performers also work more efficiently across a range of key finance processes and activities. For example, relative to the comparison group, top-performing SSCs:
- Complete the monthly financial close two days faster;
- process nearly twice the number of invoices per FTE;
- have a higher first contact resolution rate; and
- process more purchase orders per finance FTE responsible for creating/distributing purchase orders (Figure 4).
Figure 4: Efficiency Metrics: Top Performers Versus Comparison Group
Attributes of Top Performers
Top-performing SSCs are not top performers by accident. These organizations put substantive time, effort, and resources toward ensuring that SSCs and the finance function more broadly run as efficiently, productively, and cost effectively as possible. DeMent and Robinson described key attributes of top performers in areas including:
- Structure and governance;
- end-to-end processes;
- adoption of technologies like robotic process automation (RPA) and intelligent automation (IA); and
- virtual work.
STRUCTURE AND GOVERNANCE
Top performers are more likely to be part of a multi-function shared services model that includes finance along with other functional areas, while SSCs within the comparison group are more likely to cover finance only. Robinson said that SSCs are increasingly adopting the multi-function model: “Many of the companies that are thinking about implementing shared services today are often implementing multi-function models from the very beginning. More mature companies are often looking at how they can combine their single-function shared services into a multi-function model or looking even more broadly at global business services.”
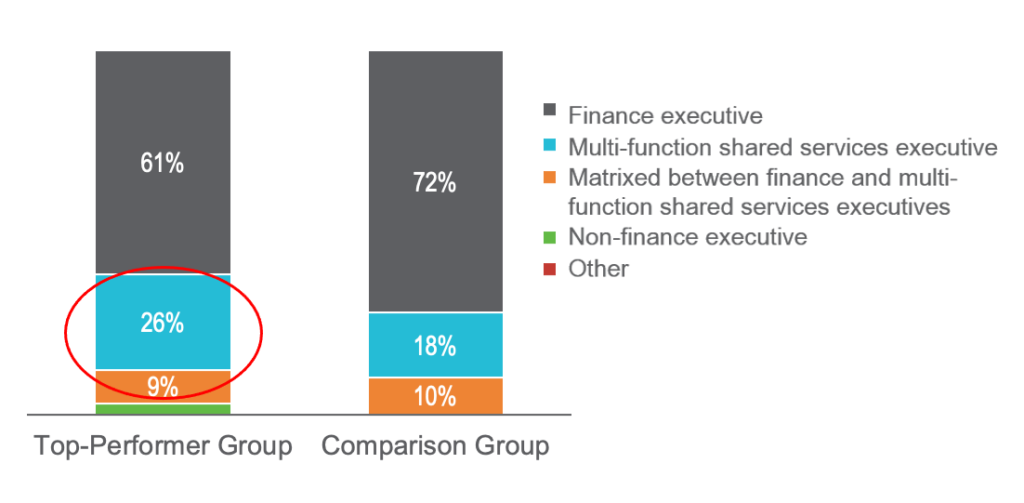
Leveraging a multi-functional shared services model does have bearing on which executive shared services will report to. For example, while a majority of organizations on the whole report to a finance executive like the CFO, more than a quarter of top performers (26 percent) report to a multi-function shared services executive. For another nine percent, reporting is matrixed between finance and multi-function shared services executives (Figure 5).
Figure 5: To whom does your shared services center report?
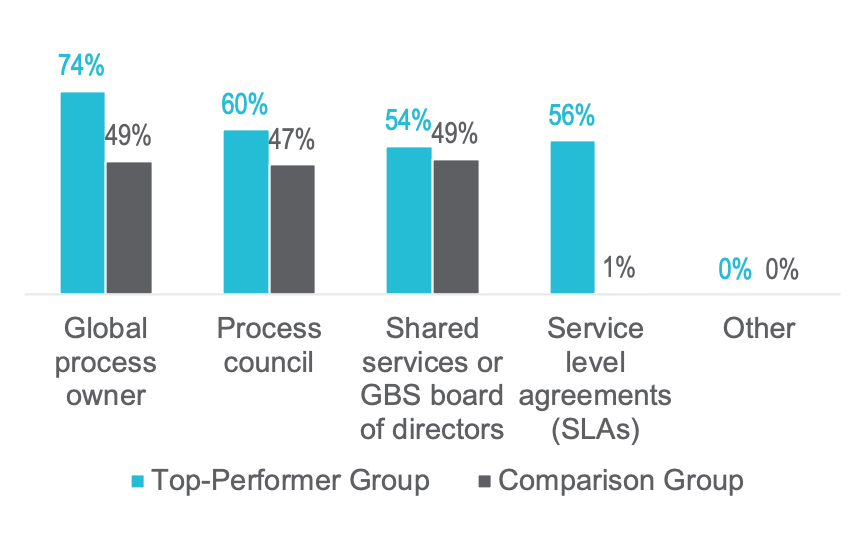
Top performers stand out from the comparison group in at least two ways when it comes to governance. First, top performers are far more likely to leverage the global process owner role than the comparison group (74 percent vs. 49 percent, respectively). Secondly, top performers are also far more likely to leverage service level agreements (SLAs) than the comparison group (56 percent versus 1 percent; Figure 6). SLAs have become less common in general, and Robinson noted that “many organizations are shying away from them partly because they think that the administrative burden of measuring them and having those conversations with internal customers is too difficult.” Top performers, by contrast, “continue to use SLAs because they want to operate as a business within a business and SLAs are part of that.”
Figure 6: What governance models does your SSC use in any capacity for global process governance?
END TO END PROCESSES
Another characteristic that distinguishes top performers is the extent to which end-to-end processes are within the scope of shared services. Top performers adopt end-to-end processes like procure-to-pay and order-to-cash more frequently than the comparison group (Figure 7).
Figure 7: Percentage of SSCs That Have The Following End-to-End Processes in Scope

While the differences between top performers and the comparison group do not appear to be large, Robinson suspects the gaps are wider in reality: “People might use phrases like ‘procure-to-pay’ or ‘order-to-cash’ even when they don’t truly have those models. For example, someone might call their AP department ‘procure-to-pay,’ and when you press them on it you realize that they’re actually doing something more like ‘invoice-to-pay.’ Sometimes people just apply these labels but they aren’t actually operating an end-to-end process.” Robinson noted that one good indicator of whether processes are truly end-to-end is the presence of the global process owner role (which top performers leverage far more often): “That tells me that they’re not just applying a label but are actually operating with that model and leveraging that governance as well.”
ROBOTIC PROCESS AUTOMATION AND INTELLIGENT AUTOMATION
Top performing SSCs are further along the adoption curve for robotic process automation (RPA) and intelligent automation (IA) than the comparison group. For example, 56 percent of top performers report that they are leveraging RPA, compared to 39 percent of organizations in the comparison group (Figure 8). Robinson said this points to at least two insights:
1. Top performers have not only made investments in RPA, but have successfully implemented governance and scaled RPA across the enterprise.
2. Top performers have put in the time and effort to standardize and streamline finance processes, which are critical steps for realizing greater efficiency through RPA.
Figure 8: To what extent does your SSC use RPA?

Along with RPA, top performers are further along when it comes to adopting IA technologies like chat bots, virtual agents, and cognitive computing tools. Nearly half of organizations in the top-performer group (46 percent) currently leverage these technologies in their SSCs, compared to 29 percent of the comparison group.
VIRTUAL WORKFORCE
Lastly, top-performing organizations report a higher percentage of remote employees under a normal operating model (and not, for example, due to COVID-19). Top performers have up to 12 percent of their SSC employees working virtually, compared to only 5 percent within the comparison group (Figure 9). “Top-performing organizations often use work-from-home as a way to reward employees in the jobs that they do,” Robinson explained. These organizations typically have stronger collaboration tools in place and have largely eliminated manual and paper-based processes, which helps them to work in a more agile and flexible way.
Figure 9: Under your normal operating model, what percentage of your finance shared services workforce is virtual?

Robinson anticipates that once the COVID-19 pandemic is over, “most organizations are going to retain a substantial virtual workforce,” to achieve cost savings. The challenge going forward will be maintaining engagement, Robinson said. “Over time, employees become less engaged and begin to feel like independent contractors. Many companies are going to have to figure out how they can maintain employee engagement over their virtual workforce as they continue to work virtually in the future.”
Conclusion
The benefits of being a top performer are clear. These organizations have significantly better staffing ratios, lower costs, and higher productivity than the comparison group across a wide range of metrics. Top performers achieve these advantages through steady investments in technology, process, and people, along with careful attention to areas like structure and governance. These areas all hang together—For example, investments in technologies like RPA will not pay off if processes are not optimized for automation first. Automation, meanwhile, enables paperless processes and a higher likelihood of remote work (which in turn helps drive lower costs). Top performers take a structured, methodical, and deliberate approach in all of these areas to ensure that SSCs deliver value for organizations as well as their customers.
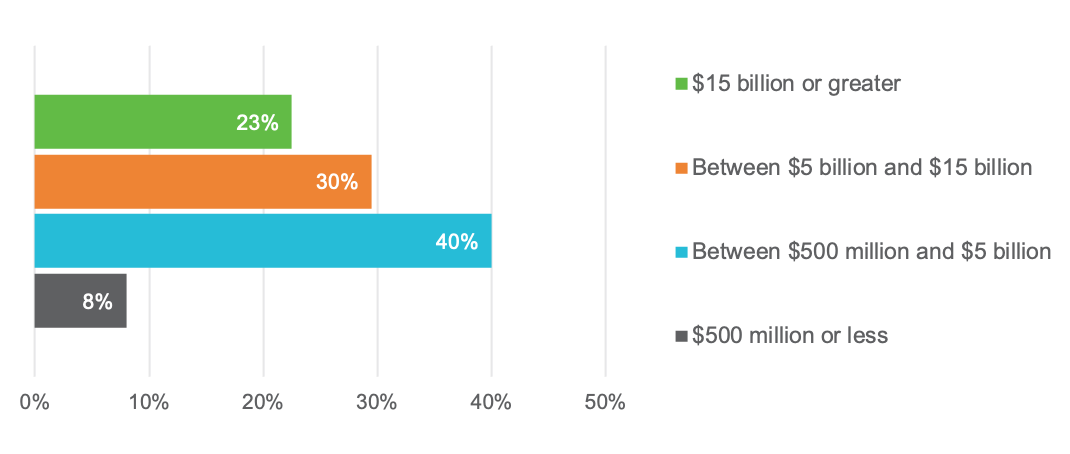
Study Demographics
The results summarized represent 200 participating organizations from the US or Canada. Company size is balanced across the revenue profile (Figure 10), with median revenue of $11.9 billion. Most organizations (87 percent) have been operating over three years, and more than half (55 percent) have been operating for over five years.
Study Population: Business Entity Revenue