

A Structured Approach to Determine What Reliability Improvements Cost
Introduction
Keep the lights on. Ensure safe, reliable, and affordable service. These are core mandates for electric utilities. To fulfill these mandates, electric utilities must make prudent investments in reliability programs and projects to maintain their transmission and distribution (T&D) systems. When load was growing year over year and power flowed in one direction from centralized generation facilities through long run transmission and stepped down through distribution facilities, this was a straightforward (if not necessarily simple) exercise.
| Key Industry Trends |
|---|
|
Trends are reshaping the electric industry (see inset) and changing how reliability programs and projects are prioritized. As load growth has declined, the revenue collected from volumetric charges can stall as well. This pressures capital requests due to the need to manage the rate impact to customers. That, in turn, constrains the overall “pie” of available capital. Compounding this issue is the need to flexibly accommodate two-way power flow, which requires new types of equipment and management systems. These too require significant capital investment or additional slices of an already constrained pie. Finally, utilities are facing an inherent challenge to maintain reliability as infrastructure ages, and they find they must react to powerful, damaging storms on a regular basis.
As they assess which projects to fund, utilities should bear in mind that regulators will expect the reliability fundamentals to be strong before sanctioning advanced capabilities. While many jurisdictions have adopted additional requirements for utilities to address distributed energy resources, none have backed away from the reliability mandate to minimize the frequency or duration of system disruptions. In this challenging environment, maintaining or improving reliability requires determining the reliability benefit of a project per dollar spent and prioritizing projects accordingly.
ScottMadden has helped many utilities get the most reliability for the dollar using a five-step process (see Figure 1).
Figure 1: Five-Step Methodology
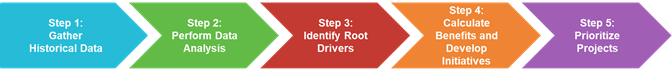
The process focuses on developing an understanding of the main drivers affecting reliability performance and identifying the most significant causes of the problems that should be addressed to make improvements.
There is often an insightful story hidden in the data which will tell you how you are operating the business, and the objective of data analysis is to find that story. When you understand the main drivers that affect your performance, then high-impact solutions (often in the form of initiatives) can be developed to address those drivers.
The sections below illustrate an example of how this type of analysis can help you get the most reliability for the dollar. The example below uses System Average Interruption Frequency Index (SAIFI); however, the process is repeatable for any metric.
Step 1: Gather Historical Data
The key to identifying and prioritizing investments in the T&D system begins with an in-depth analysis of the historical reliability performance data. This type of analysis depends heavily on the accessibility and accuracy of outage related data. It is of utmost importance that utilities implement robust practices to ensure that outage-related events are coded and logged correctly and labeled into major categories and sub-categories to facilitate this analysis. However, it is never the case that the data is pristine or perfect.
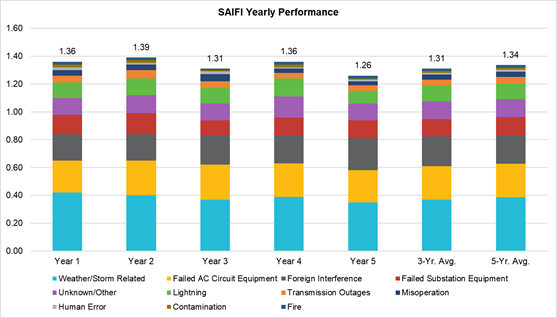
Data analysis starts by compiling and organizing all the historical performance data and developing a structured approach to decompose the information into categories. A common utility practice is to separate weather-related vs. non-weather-related events. In addition, it is recommended that major event days (MEDs) are excluded from the analysis, so you are examining performance under normal operating conditions. It is recommended that a three or five-year trending analysis be conducted to ensure all new proposed initiatives address the major performance reliability gaps (see Figure 2). The analysis involves a deeper dive into each of the major categories and identifying the major contributors affecting performance.
Figure 2: SAIFI Yearly Performance (Five-Year Trend)
Step 2: Perform Data Analysis
Trending analysis of the historical data enables the user to determine whether recently implemented initiatives had an impact on reliability performance and if the major contributors affecting performance have changed over time. Analyzing the breakdowns of the three-year and five-year averages could provide the user an idea of where to start (see Figure 3). Like a police detective searching for evidence, this analysis focuses on scrutinizing the data to find “clues” on what the major offenders are and developing improvement actions to address them.
Figure 3: SAIFI Performance Breakdown (Three-Year and Five-Year Averages)
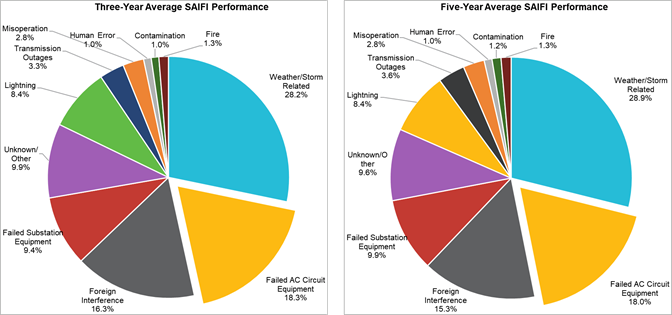
The three-year and five-year average breakdowns in Figure 3 illustrate almost identical results, with the following four categories representing approximately 72% of the overall performance: Weather/Storm Related, Failed AC Circuit Equipment, Foreign Interference, and Failed Substation Equipment. Data analysis efforts should focus first in these four categories, since it provides the user with a higher probability of improving performance.
To illustrate this point, we’ll focus the analysis on the Failed AC Circuit Equipment category. Figure 3 suggests that a deeper dive into the Failed AC Circuit Equipment category is needed to understand what is driving such a high number of AC equipment failures in the system. The idea is to further “slice” the data into multiple views that would help the user identify the common threads driving these equipment failures and brainstorm practical solutions that would help mitigate the problem.
Step 3: Identify Root Drivers
In most instances, it is possible that a small number of key contributors are responsible for the bulk of the metric performance. The key for developing meaningful initiatives is to focus on the key contributors and identify the associated root drivers that led to past outcomes. There are plenty of root cause analysis methods available to the user (e.g., Five Whys, Fishbone Diagram, etc.), but what is important during this step is to leverage the data available to justify the expected outcomes of an investment based on analytics. In other words, each initiative developed through this method will have an associated improvement measure that is based on historical performance. The message to the capital approval process is, “If you give me X dollars, I will give you Y reliability improvement.” Figure 4 shows a detailed breakdown of the Failed AC Circuit Equipment category. From this illustration, we can observe that just nine categories (out of 43) are responsible for approximately 70% of the category performance.
Figure 4: Failed AC Circuit Equipment Breakdown (Three-Year Average)
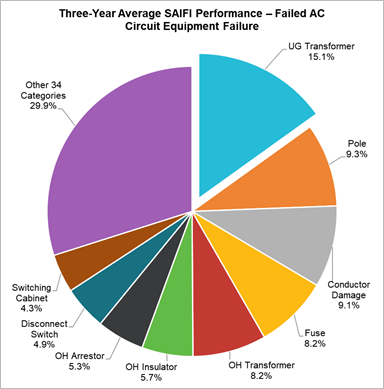
Naturally, the next step is to pick the top contributors for further analysis and root driver identification. During this process, it is important that T&D field personnel are engaged to serve as a “sounding board” for the analysis (e.g., “have you observed this in the field?”, “what are the most common failures encountered?”, etc.). The goal is to develop a “hypothesis” on what the root driver might be and find the facts that prove or disprove your hypothesis. Based on Figure 4, one hypothesis could be that a substantial portion of underground (UG) transformer failures are simply due to the equipment’s old age. The user would then need to think through what kind of information is needed to complete the analysis and search for the data accordingly. For example, for the UG transformer failures, it would be useful for the user to know the number of failures for the analysis period with corresponding OEM data and install age. Figure 5 below illustrates this with genericized example data.
Figure 5: Underground Transformer (UG) Failures (Illustrative – Year 1)
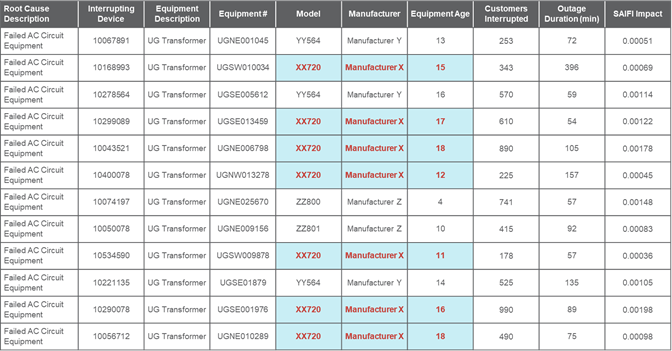
Assuming the pattern of equipment failures shown in Figure 5 holds true for all failures within the analysis period, then one possible driver for UG transformer failures could be the equipment age. Furthermore, legacy UG transformers from a specific manufacturer (i.e., “Manufacturer X”) could be targeted for additional analysis and improvement opportunity identification.
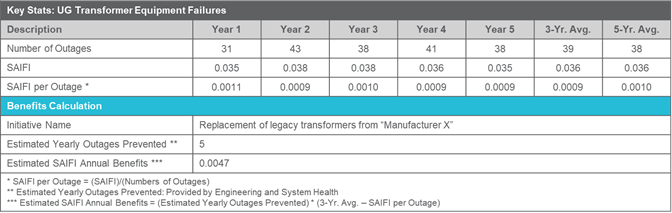
Step 4: Calculate Benefits and Develop Initiatives
Once root drivers have been identified, targeted initiatives are developed for implementation. The key for developing robust initiatives that generate enough “buy-in” from senior leaders is to translate the conducted data analysis into the expected benefits to be realized. One way to accomplish this is to calculate the contribution to the metric per outage impact (e.g., SAIFI per Outage) for each initiative and utilize this calculation as the proxy for estimating the reliability benefits to be gained. Figure 6 illustrates the metric per outage calculation for the UG transformer example discussed above. It is important to note that all estimated benefits have an associated “shelf life” with diminishing returns after the first few years of implementation.
Figure 6: Benefits Calculation (Illustrative)
The next step in this process is to review the different technologies available for each initiative and select the best technology that enables the expected reliability benefits but also provides additional value to the organization. Technology selection criteria should consider factors such as, but not limited to:
-
Corporate/strategic objectives
-
Grid modernization efforts
-
Cost
-
Technology maturity
-
Operations and maintenance
-
Training and change management
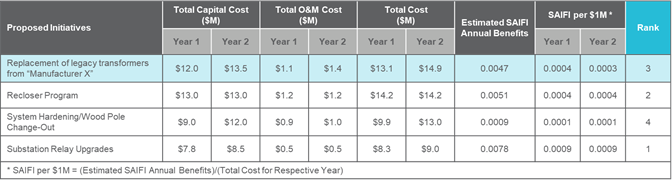
Step 5: Prioritize Projects
The last but most crucial step of this process is to leverage the data analysis conducted to develop a structured approach to prioritize all initiatives. To begin, detailed cost information and estimated reliability benefits are needed for all proposed initiatives. The approach revolves around calculating how much reliability benefit to expect per million dollars ($1M) in spend. The result is a reliability per cost metric that normalizes the reliability benefit by the associated cost (i.e., “how much do I get for every million dollars I spend on this initiative?”). This calculation proves to be a powerful tool to communicate the expected benefits to senior leaders and secure funding for the next business plan cycle. Figure 7 illustrates this approach.
Figure 7: Prioritization Table – SAIFI per $1M (Illustrative)
How ScottMadden Can Help
ScottMadden can leverage deep industry experience and broad management expertise to help you deliver results for your organization. We tailor this approach to your specific needs, and we adjust the scope from a deep dive on a single business issue to enterprise-wide business planning. Specific areas of expertise include:
Analysis support – ScottMadden consultants bring analytical rigor and an understanding of the entire electric delivery value chain to support your analysts in digging deep into the data to understand root drivers and develop the appropriate solutions. We transfer knowledge so you can replicate the process after the project is over.
Integrating the analysis and prioritization into budgeting processes – Analysis and prioritization alone provide insight, but to make the results lasting and repeatable, they should be integrated into your corporate-budgeting processes. ScottMadden can work with your finance and accounting teams to redefine your budgeting processes to include the analytical rigor necessary
Aligning organization policies, processes, and procedures – Budgeting is not the only process that is impacted by this type of analysis. Root driver analysis insights will change the way your business units plan and operate. ScottMadden brings an organized framework to understand the impact of the analysis, and we will work with your business areas to modify processes to align with the new operating model.
Governance and implementation methodologies – As business processes change, often so do the governance and decision-making constructs. ScottMadden has deep experience in implementing new governance models to accompany organizational and process changes.
Developing training material and change management for lasting success – For each project, ScottMadden considers how these changes should be messaged and tailors the approach accordingly. The training material developed as part of these efforts focuses on lasting organizational success, using train the trainer methods, among others.