There has been a lot of discussion concerning the Texas electricity grid this year, particularly since Winter Storm Uri hit the state in February 2021. Regulators, utility executives, and customer advocacy groups are reviewing and assessing the reasons for widespread blackouts in the Electric Reliability Council of Texas (ERCOT), the state’s principal electricity grid, and considering how to prevent an energy shortage from happening in the future. These investigations will ultimately uncover why power plants failed and how to better prepare them and the overall system for the next incident.
Beyond uncovering reasons for plant failures, this event has sparked discussion about the generation mix of Texas (and other grids) as many jurisdictions seek to shift to lower CO2-emitting resources. Some experts suggest that the events in Texas may be the strongest case yet for renewable energy (see this article as an example). This position made us consider a key question:
How would a different generation mix have performed in ERCOT?
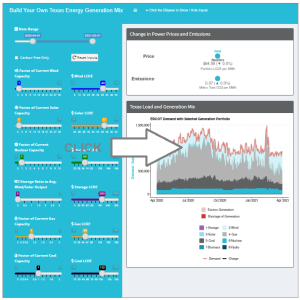
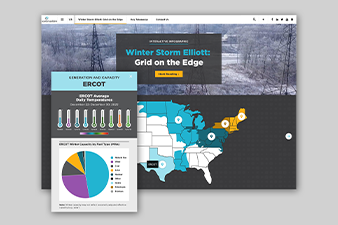
The focus is not on why plants performed the way they did, but instead, given what we know about how they did perform, would a different mix of generation sources have done any better at meeting the demand? If so, at what cost and emissions profile? To answer this question, we built an interactive model to determine how the ERCOT grid would have performed with a different generation mix. If you have ever wondered what Texas could have looked like as a carbon-neutral state, now is your chance to build it. We encourage you to consider these key questions when interacting with this tool:
The focus is not on why power plants performed the way they did, but instead, given what we know about how they did perform, would a different mix of power generation sources have done any better at meeting the demand? If so, at what cost and emissions profile? To answer this question, we built an interactive model to determine how the ERCOT grid would have performed with a different electricity generation mix.
If you have ever wondered what Texas could have looked like as a carbon-neutral state, now is your chance to build it. We encourage you to consider these key questions when interacting with this tool:
What would happen if you significantly increased solar power capacity?
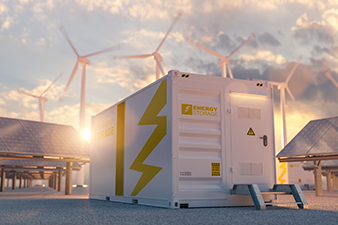
- How much energy storage would you build to supplement renewable generation?
- Would you add more nuclear energy capacity as baseload generation?
- What about the amount of wind energy needed to serve the load?
- How difficult would it have been to meet periods of high energy demand in times of low renewable output or conversely minimize excess production when renewable output was very high, but demand is low?
- What would you use as a replacement for coal- or gas-fired generation?
- What is the impact of your changes on the cost of energy, as measured by the Levelized Cost of Energy (LCOE)?
- What is the impact on carbon emissions?
The Model
Our interactive model allows for the adjustment of energy generation resources to see if that proxy generation portfolio could have reduced emissions while still meeting the state’s actual electricity demand over the study period (January 2020 through April 2021).
In building the model, we reviewed daily actual electricity output and capacity factors by generation type for the period leading up to and including Winter Storm Uri. Total daily generation can be used as a reasonable proxy for the measure of demand (i.e., the system produced the power to meet demand, ignoring any imports or exports). By varying the total capacity of each generation source and applying the known capacity factor from that day, the model calculates what resource category or type would have been used. Surplus energy to the daily demand is noted in light red, while any energy deficit is shown in bold red. Using average resource costs for each generation type, the model estimates the impacts on the cost of energy.
As a first step, a baseline scenario was developed using the following assumptions:
- Collected historical data of energy generation by type (i.e., nuclear, solar, wind, etc.) by day over the study period
- Used Lazard LCOE to compare costs across generation types.
- Set the baseline portfolio for wind, solar, natural gas, and coal-fired generation as the LCOE mid-point of Lazard’s unsubsidized pricing
- Used NuScale Small Modular Reactor (SMR) LCOE of $65/MWh for nuclear resources
- Calculated a portfolio price based on the current generation mix as a reference point for alternative portfolios
Because this analysis is a thought exercise regarding the ERCOT generation mix, the model requires building all-new generation sources.
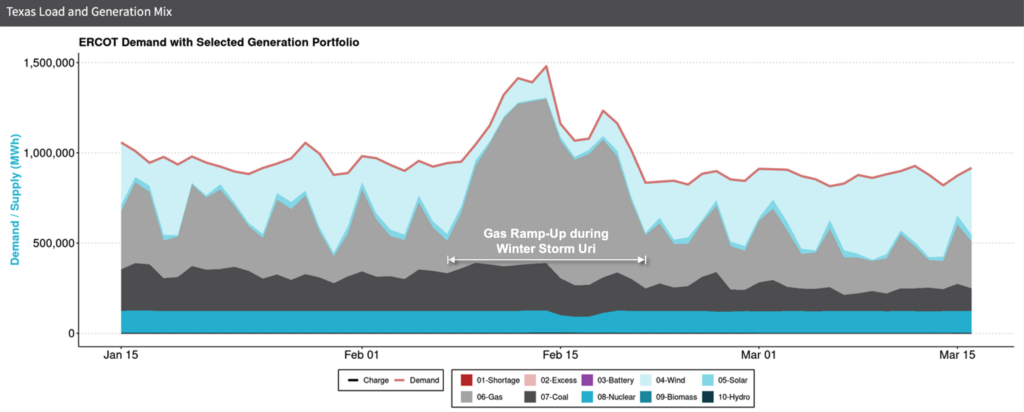
In developing the baseline scenario, it becomes apparent, that there are a few times throughout the study period where meeting demand without fossil fuels would have proven difficult. There are two instances of particularly high demand at a time when renewable output was low for extended periods: September 2020 and February 2021.
The February 2021 Winter Storm Uri (February 13-17) is obviously the most well-known instance.
The second such period, and less well known, was in September 2020 when renewable energy production was low for several days, while high temperatures led to demand increases that required a ramp-up of natural gas generation.
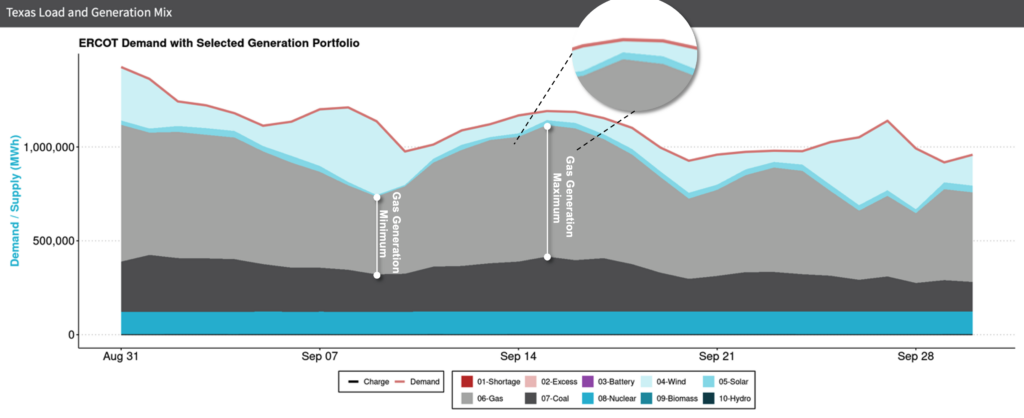
Specifically, a drop in wind generation (from 35% capacity factor on September 9, 2020, to 4% on September 15, 2020) resulted in significant under-production of zero-carbon resources, and natural gas generation was called upon to meet demand and maintain system reliability.
Furthermore, demand response efforts were present during these two events, so actual demand was likely higher than what is reflected at those times.
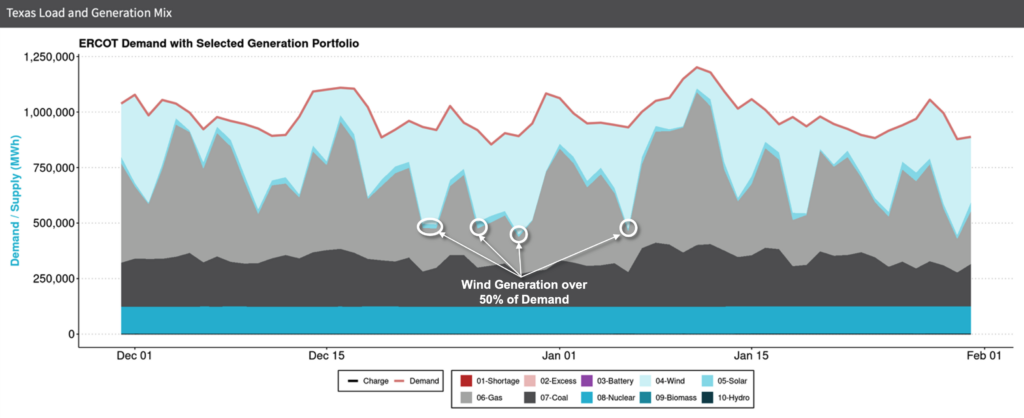
Conversely, there are times over the study period when renewables comprised a significant portion of the generation mix and any major increase above current capacity would have created “overproduction.” See examples from December 17, 2020, to January 4, 2021, below.
Using the model, we ran an “increased renewable, no storage” scenario to see how building an alternative electricity generation mix would have performed over the study period. In this scenario, we increased wind and solar capacity by more than four times the current capacity and kept the existing nuclear power plants and hydro sites at their current operating capacity. We removed natural gas and coal-fired resources from the energy generation mix and did not consider storage alternatives.
This “increased renewable, no storage” scenario demonstrates that building exclusively intermittent resources to meet high-demand periods, like Winter Storm Uri, will result in excess energy many times throughout the study period when demand is low. There are additional scenarios that can be created in the model where excess energy is created during the study period. This excess energy can be created by generation resources whose operating characteristics are limited in their ability to ramp with demand.

As a result of various model iterations (i.e., changing assumptions and reviewing results), we identified the following questions, which will be explored in future episodes.
-
- What opportunities exist if we create excess energy from changing the current generation mix?
- What is the changed land use to support a different generation mix?
- What would be the “least-cost” answer in terms of renewables and storage?
- Can SMRs be constructed economically to be a carbon-free source?
- Is there a generation mix that can significantly reduce coal and gas and minimize carbon emissions to near zero?
We encourage you to interact with this model and test how your potential generation mix would have impacted carbon emissions and the cost of energy. As you interact with this tool, there will be a significant number of questions that arise from this “what-if” analysis.
Please contact us to discuss our perspective on the questions that our clients are asking, our perspective on addressing these questions, and any potential implications of various solutions that arise from these different “what-if” scenarios.


