



In November 2024, Brad DeMent and Trey Robinson from management consulting firm ScottMadden delivered a webinar to discuss the results of their latest finance shared services benchmarking study. Designed by ScottMadden and administered by APQC in June 2024, the study gathered data from respondents in 103 shared service organizations (SSOs) across four main areas:
- Delivery model and operations
- Staffing
- SSO management infrastructure and technology
- Performance
Drawing on the survey results, this article summarizes key findings and analysis on cost savings in finance shared services. While shared service centers help lower finance costs for many organizations, those with mature approaches to technology and process management often achieve significantly greater savings than their peers and competitors.
Non-Labor Savings Are Growing Rapidly
Traditionally, organizations implemented finance shared services as a way to reduce headcount and, in turn, labor costs, which are the largest driver of cost for the finance function. Labor-related savings continue to make up a majority of the savings generated by SSOs (Figure 1).
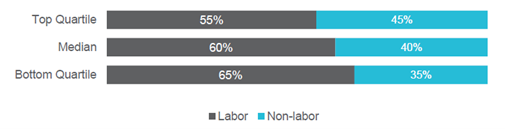
Robinson said that more recently, however, “we’re seeing more and more non-labor-related savings.” At the median, SSOs now generate $593,128 in non-labor savings per $1 billion in revenue, up 63% since the previous survey.
Specific drivers of non-labor cost savings include:
- Accounts payable discounts (62% of respondents)
- Reduced errors and better controls (58%)
- Improved collections (54%)
- Better working capital (51%)
- Reduced turnover costs (e.g., training [45%])
- Reduced audit fees (31%)
Top Performers Save the Most
Through its analysis of finance shared services cost benchmarks, ScottMadden found that some organizations are spending significantly less than others to operate their SSO and the finance function as a whole (Figure 2).
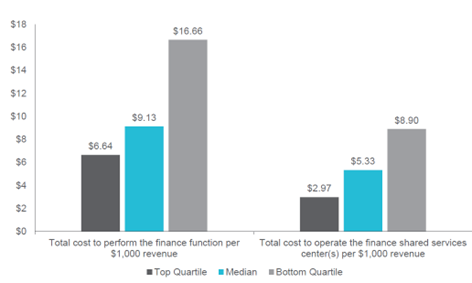
Organizations in the bottom quartile spend the most to perform the finance function at $16.66 per $1,000 revenue, while organizations in the top quartile spend less than half that amount to carry out the same set of processes ($6.64). Organizations in the top quartile also operate their finance shared services center at about one-third the cost of organizations in the bottom quartile.
Top Performer Characteristics
Factors like industry, size, and global location(s) can shape what an organization spends on its finance shared services center and on the finance function as a whole. While these factors may explain some of the differences in spending between the top and bottom quartiles, some organizations also spend less because they perform better and are more efficient across multiple areas.
To identify top-performing SSOs, ScottMadden selected eight KPIs related to areas including staffing, efficiency, customer service, and cost. SSOs that fall into the top quartile for average scores across all eight KPIs are considered top performers. 28 SSOs met these criteria, and 75 were in the comparison group (i.e., not considered top performers).
Top Performers Have More Efficient Staffing
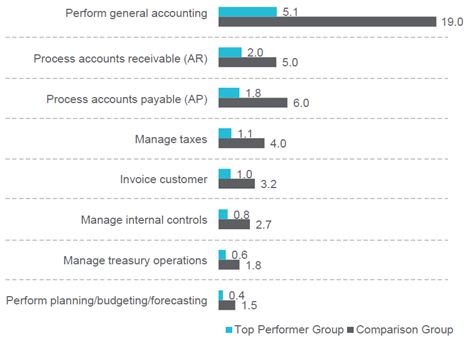
ScottMadden found several key differences between top performers and the comparison group that help explain why top performers are more cost efficient. One of the biggest differences is that top-performing SSOs are staffed much more efficiently than the comparison group. Specifically, ScottMadden found that the top performer group has a median of 25.4 full-time-equivalent employees (FTEs) for the finance function, while the comparison group has more than three times as many finance FTEs (76.7 at the median).
Top performers also staff specific finance shared services processes more efficiently, including general accounting, accounts receivable, accounts payable, customer invoicing, and more (Figure 3). Because labor is one of the biggest drivers of cost for the finance function, these efficiencies make a significant difference in overall spending.
Top performers don’t spend less and have leaner staffing because they do less. In fact, the opposite is true. ScottMadden found that relative to the comparison group, top performers:
- Offer a wider range of financial services. For example, they are 30% more likely than the comparison group to process customer credit.
- Are more likely to provide high-value services like planning/budgeting/forecasting and due diligence.
- Are less likely to outsource processes than the comparison group. For example, 15% of the comparison group outsources general accounting, compared with only 7% of top performers.
Top Performers are More Mature with Respect to Technology
Top performers’ use of technology offers at least one important clue as to how this group can spend less and do more than their peers, even with a smaller staff. Organizations that have implemented technologies like RPA, chatbots, predictive AI, or generative AI to automate finance shared services processes have more efficient staffing, with a median of 50 finance FTEs per $1 billion revenue compared with 65 for organizations without automation (Figure 4).
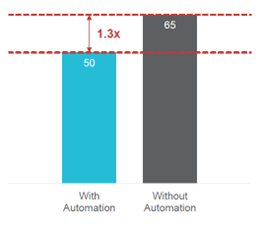
Top performers are significantly more likely to have implemented these technologies. For example, almost half of the top performer group (46%) have implemented chatbots or virtual agents, while only 28% of the comparison group have.
See Automation and AI in Finance Shared Services: A Competitive Edge for Tomorrow for more findings and analysis related to technology.
Greater automation means fewer employees are needed to carry out core finance processes. This not only improves overall staffing efficiency but also frees staff to perform higher-value services relative to the comparison group.
Top Performers Have More Mature Process Management
Beyond more efficient staffing and more mature technology approaches, top performers in finance shared services also have more mature process management. End-to-end (E2E) process adoption is a prime example. E2E processes help break down silos across functions, enable a customer-centric view of processes, and provide visibility to ensure improvements in one part of the process don’t cause problems elsewhere. Relative to the comparison group, top performers are more likely to adopt E2E finance processes like procure-to-pay, order-to-cash, and record-to-report (Figure 5).
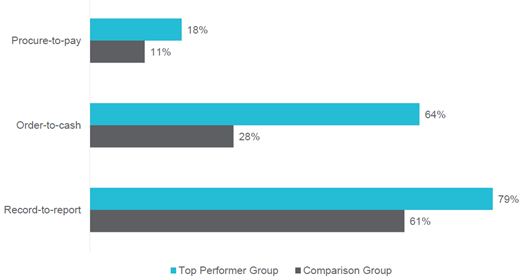
Top performers are also more likely than the comparison group to leverage global process owners for process governance (71% versus 61%, respectively). Identifying an owner or owners for an end-to-end process ensures that someone is directly accountable for managing performance, mitigating risk, and identifying opportunities for process improvement.
Key Takeaways
Finance shared services centers can generate significant cost savings for organizations that are willing to invest in building and maturing them over time. Specifically, ScottMadden found that:
- While labor costs have traditionally been the biggest source of savings for SSOs, non-labor-related cost savings are also growing rapidly.
- Top performers adopt automation technology to a greater extent than the comparison group. These technologies drive more efficient staffing, which in turn lowers overall costs.
- Top performers also have more robust process governance that enables improvement while mitigating risk.
- All three factors drive lower costs while enabling staff to do higher-value work.
About this Research
ScottMadden partnered with APQC to develop and administer a custom study focused on finance shared services, run on a biennial cycle. The 2024 survey is the study’s seventh cycle (previous cycles include 2014, 2015, 2016, 2018, 2020, and 2022).
Respondents to the 2024 survey represent 103 SSOs across diverse industries including services, retail and wholesale, financial services and banking, and more (Figure 8).
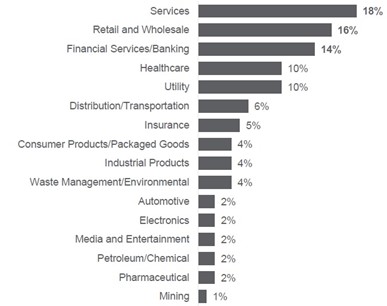
All participating SSOs are based in the US or Canada and have more than $1 billion in annual revenue (median revenue: $12 billion). Almost all (91%) have been operating for three years or longer.
About APQC
APQC (American Productivity & Quality Center) is the world’s foremost authority in benchmarking, best practices, process and performance improvement, and knowledge management (KM). With more than 1,000 member organizations worldwide, APQC provides the information, data, and insights organizations need to support decision-making and develop internal skills. Learn more.
This content includes median values sourced from APQC’s Open Standards Benchmarking database. If you’re interested in access to the 25th and 75th percentiles or additional metrics, including various peer group cuts, they’re available through a benchmark license or the Benchmarks on Demand tool depending on your organization’s membership type.
APQC’s Resource Library content leverages data from multiple sources. The Open Standards Benchmark repository is updates nightly, while other data sources follow different schedules. To provide as much transparency as possible, APQC will always attempt to provide context for the data included in our content and leverage the most up-to-date data available at the time of publication.
About SCOTTMADDEN
ScottMadden has been a pioneer in corporate and shared services and has been helping companies transform their finance and accounting organizations for several decades. Through enterprise financial business services, strategic centers of expertise, intelligent automation solutions, hybrid insource/outsource delivery models, and other solutions, ScottMadden helps organizations increase value for their company. ScottMadden’s clients span a variety of industries from energy to healthcare to higher education to retail. To learn more, visit https://www.scottmadden.com/topic/finance-and-accounting/.