


Most companies have work management and asset management ERP systems that provide generous amounts of data. The challenge is aggregating and interpreting the data to make actionable decisions regarding available on-site materials, order statuses, and more. This effort is further complicated during periods of supply chain disruption and uncertainty. A well-designed supply chain business intelligence tool can make sense of information to enhance decision-making and improve business outcomes.
Because inventory is a significant and essential asset, particularly for integrated energy companies, using business intelligence tools can mitigate risks in the supplier network and demand variability. Business intelligence tools help prepare for stock and address risks, such as the failure of critical components, storms, and other events that could negatively impact the reliable and affordable production and distribution of energy.
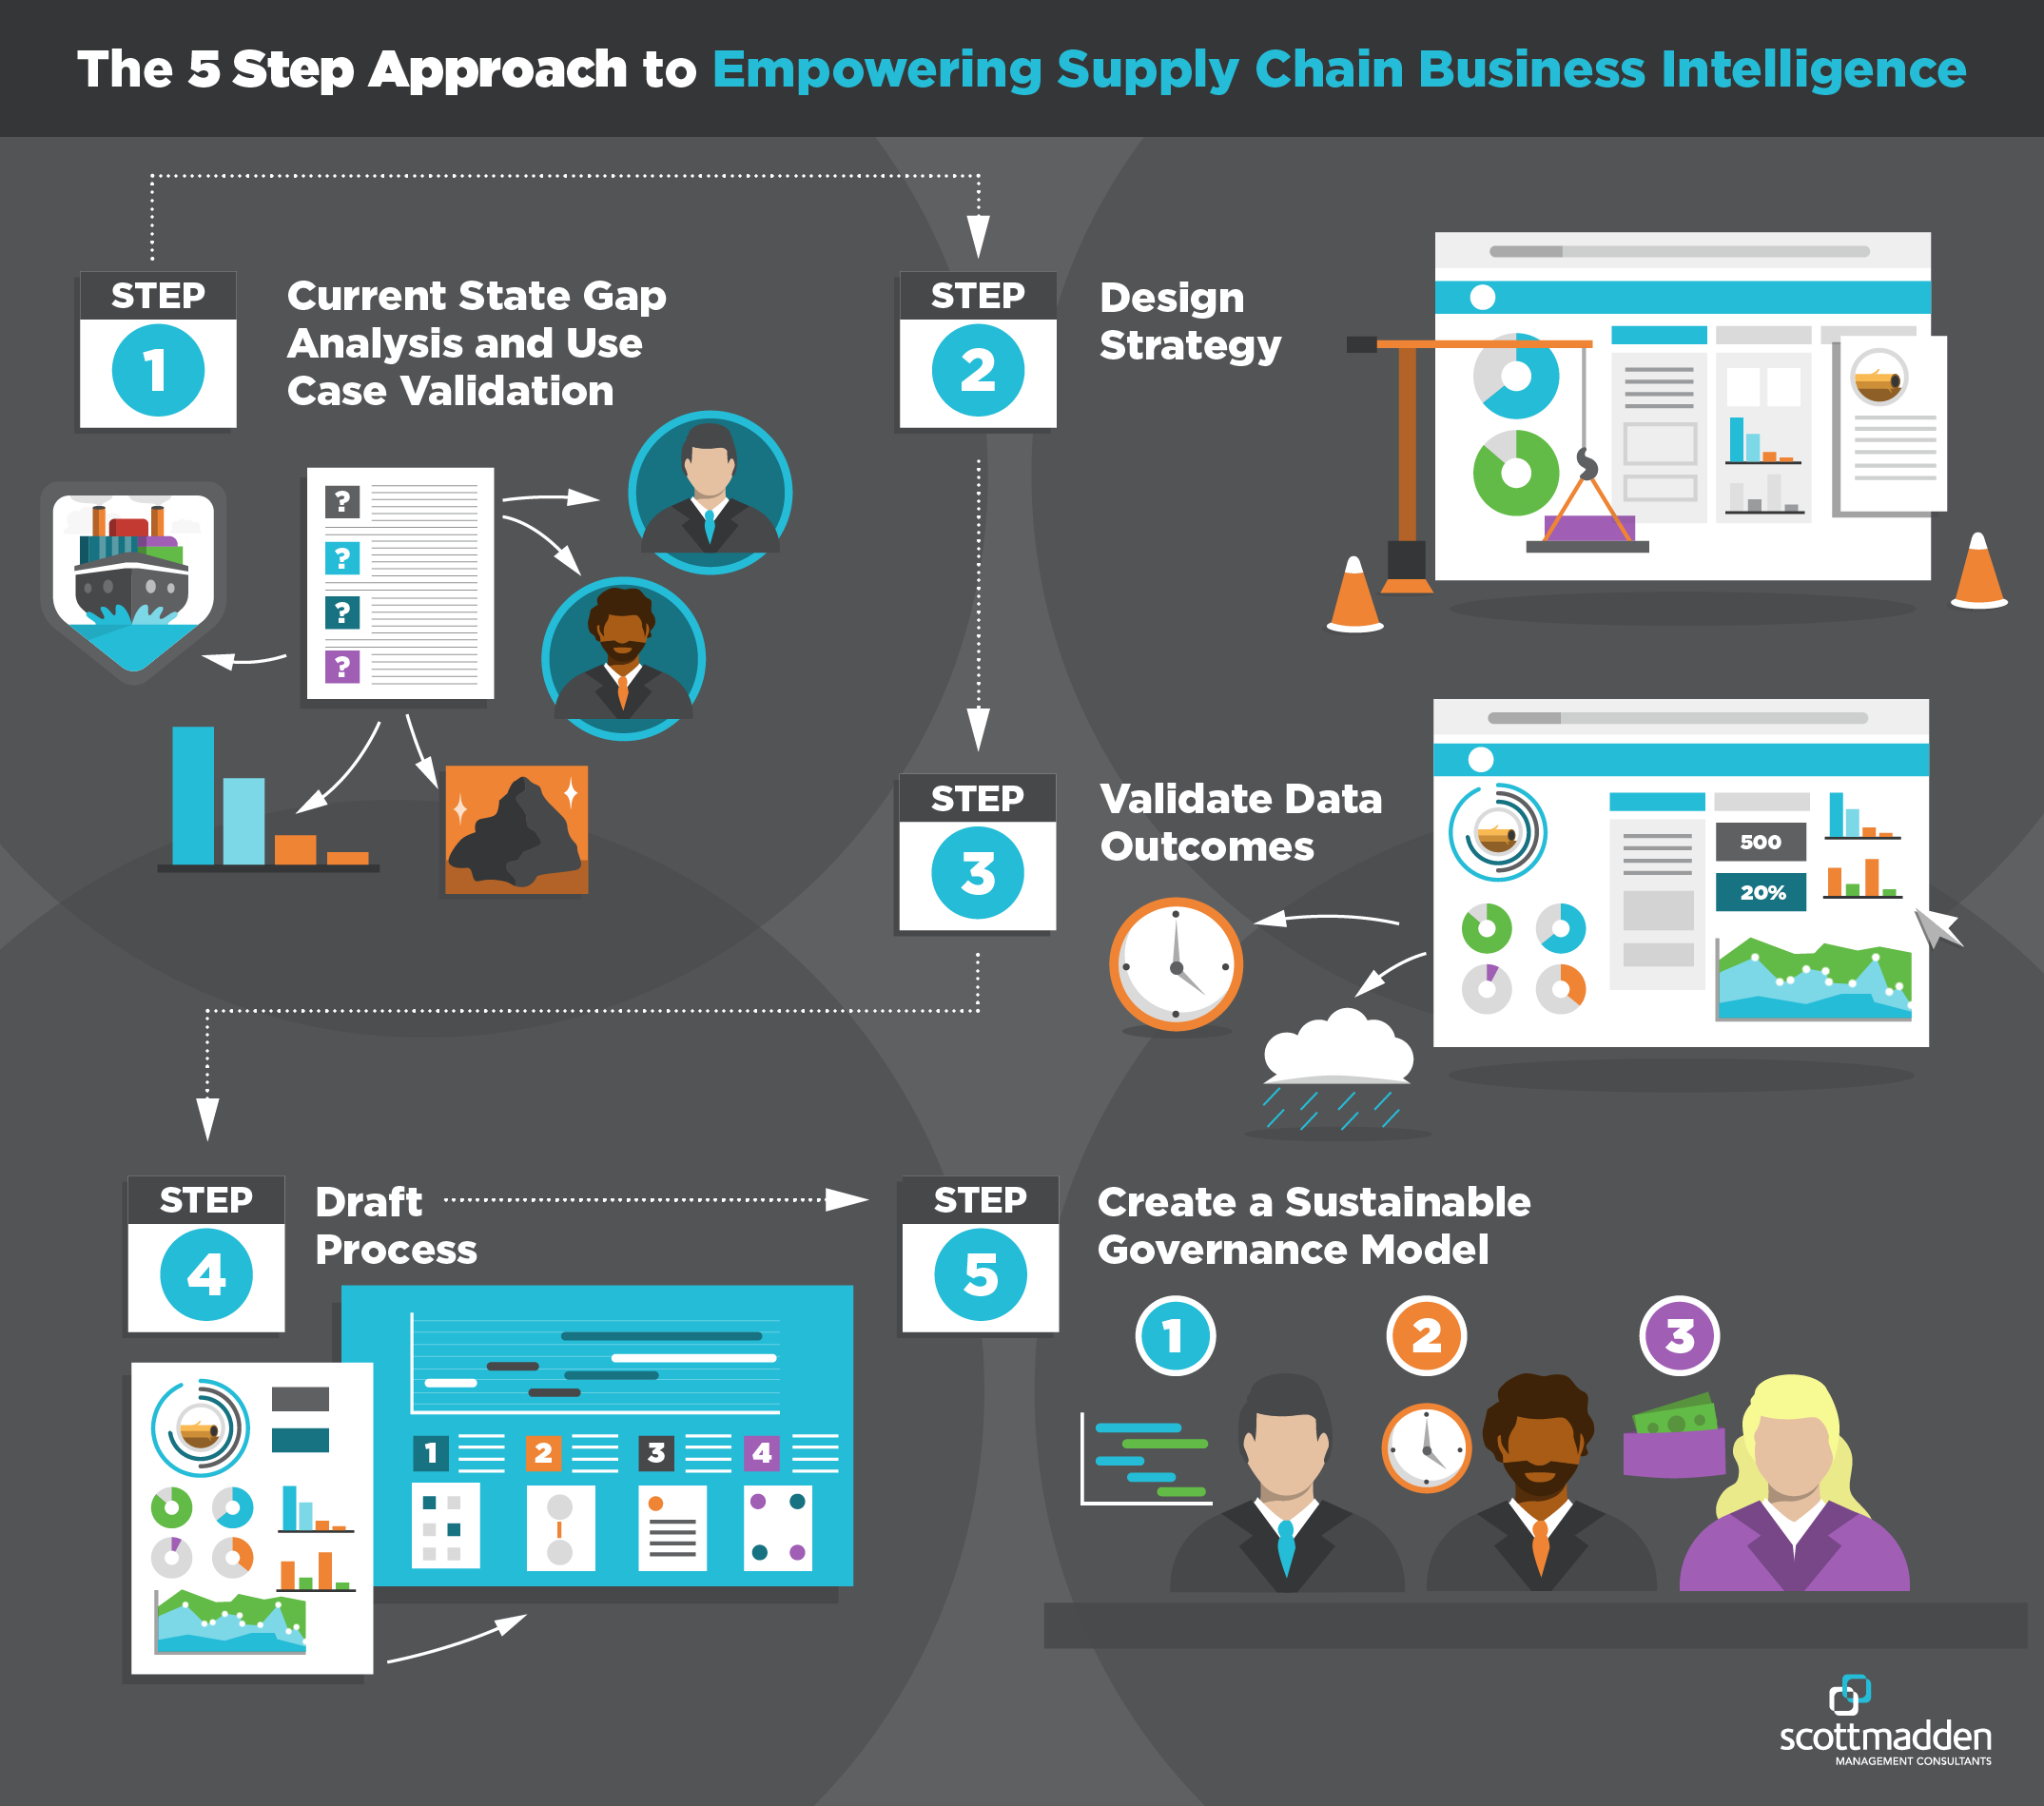
Five-step Approach
Using supply chain business intelligence tools to improve decisions requires understanding the desired outcomes of the tool, filling process and data gaps, and making better sense of available data. By leveraging the five-step approach outlined below, you can build business intelligence capabilities in a practical and implementable way.
Step One: Current State Gap Analysis and Use Case Validation
The first step is understanding what the data needs to do for users. This is accomplished through interviewing internal supply chain users and external business unit stakeholders. These interviews provide insight into current deficiencies and how a business intelligence tool will improve decision-making. For example, the internal supply chain wants to know items at risk of being unavailable before a problem arises. External business unit stakeholders are interested in walking material down for jobs on the schedule and identifying materials that need expediting.
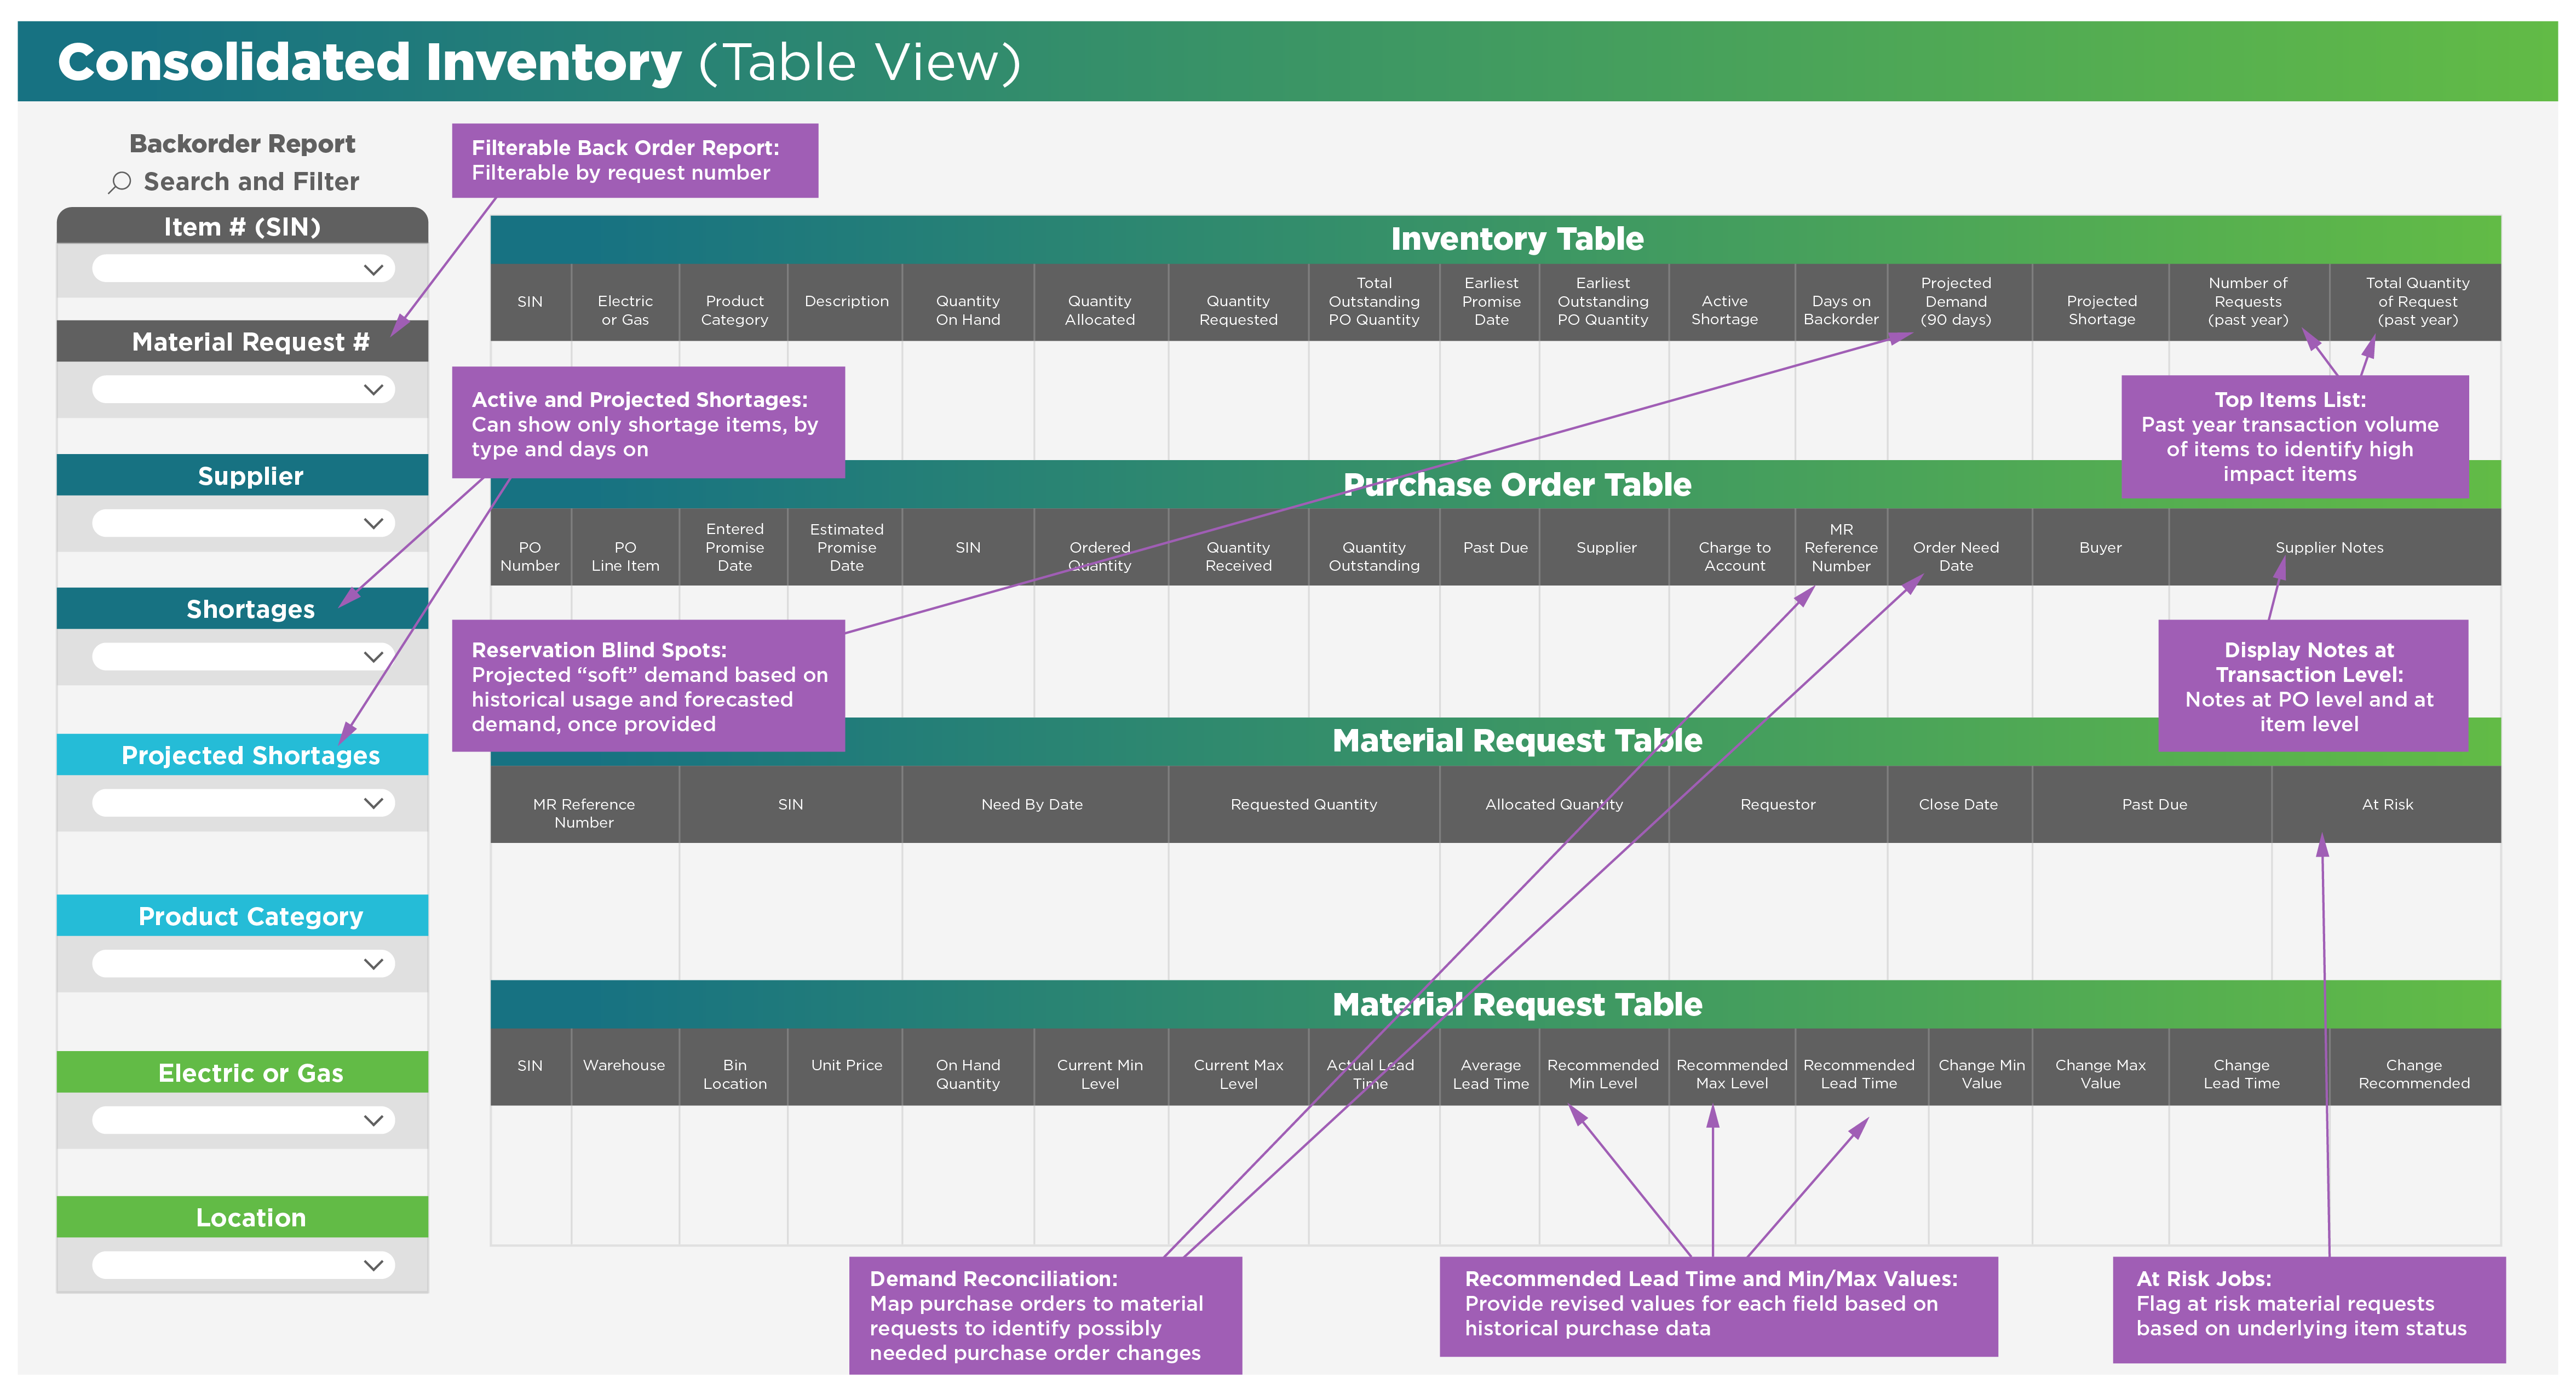
Step Two: Design Strategy
The next step is to design the dashboards. Dashboard designs must account for all high-priority use cases defined in the first step and serve as the visible layer of the supply chain business intelligence model. The front-end dashboard view must be cross-functional to enable users to better interpret data. Filters must be embedded to allow users to drill down into specific fields tied to key performance indicators. Key activities in the design phase include:
- Creating a mockup of the dashboard
- Mapping use cases
- Documenting a list of actions users expect to be able to take
- Identifying filters and logic rules used to analyze and present data
- Designing workflows that ensure the right people are notified of risks, inventory problems, etc.
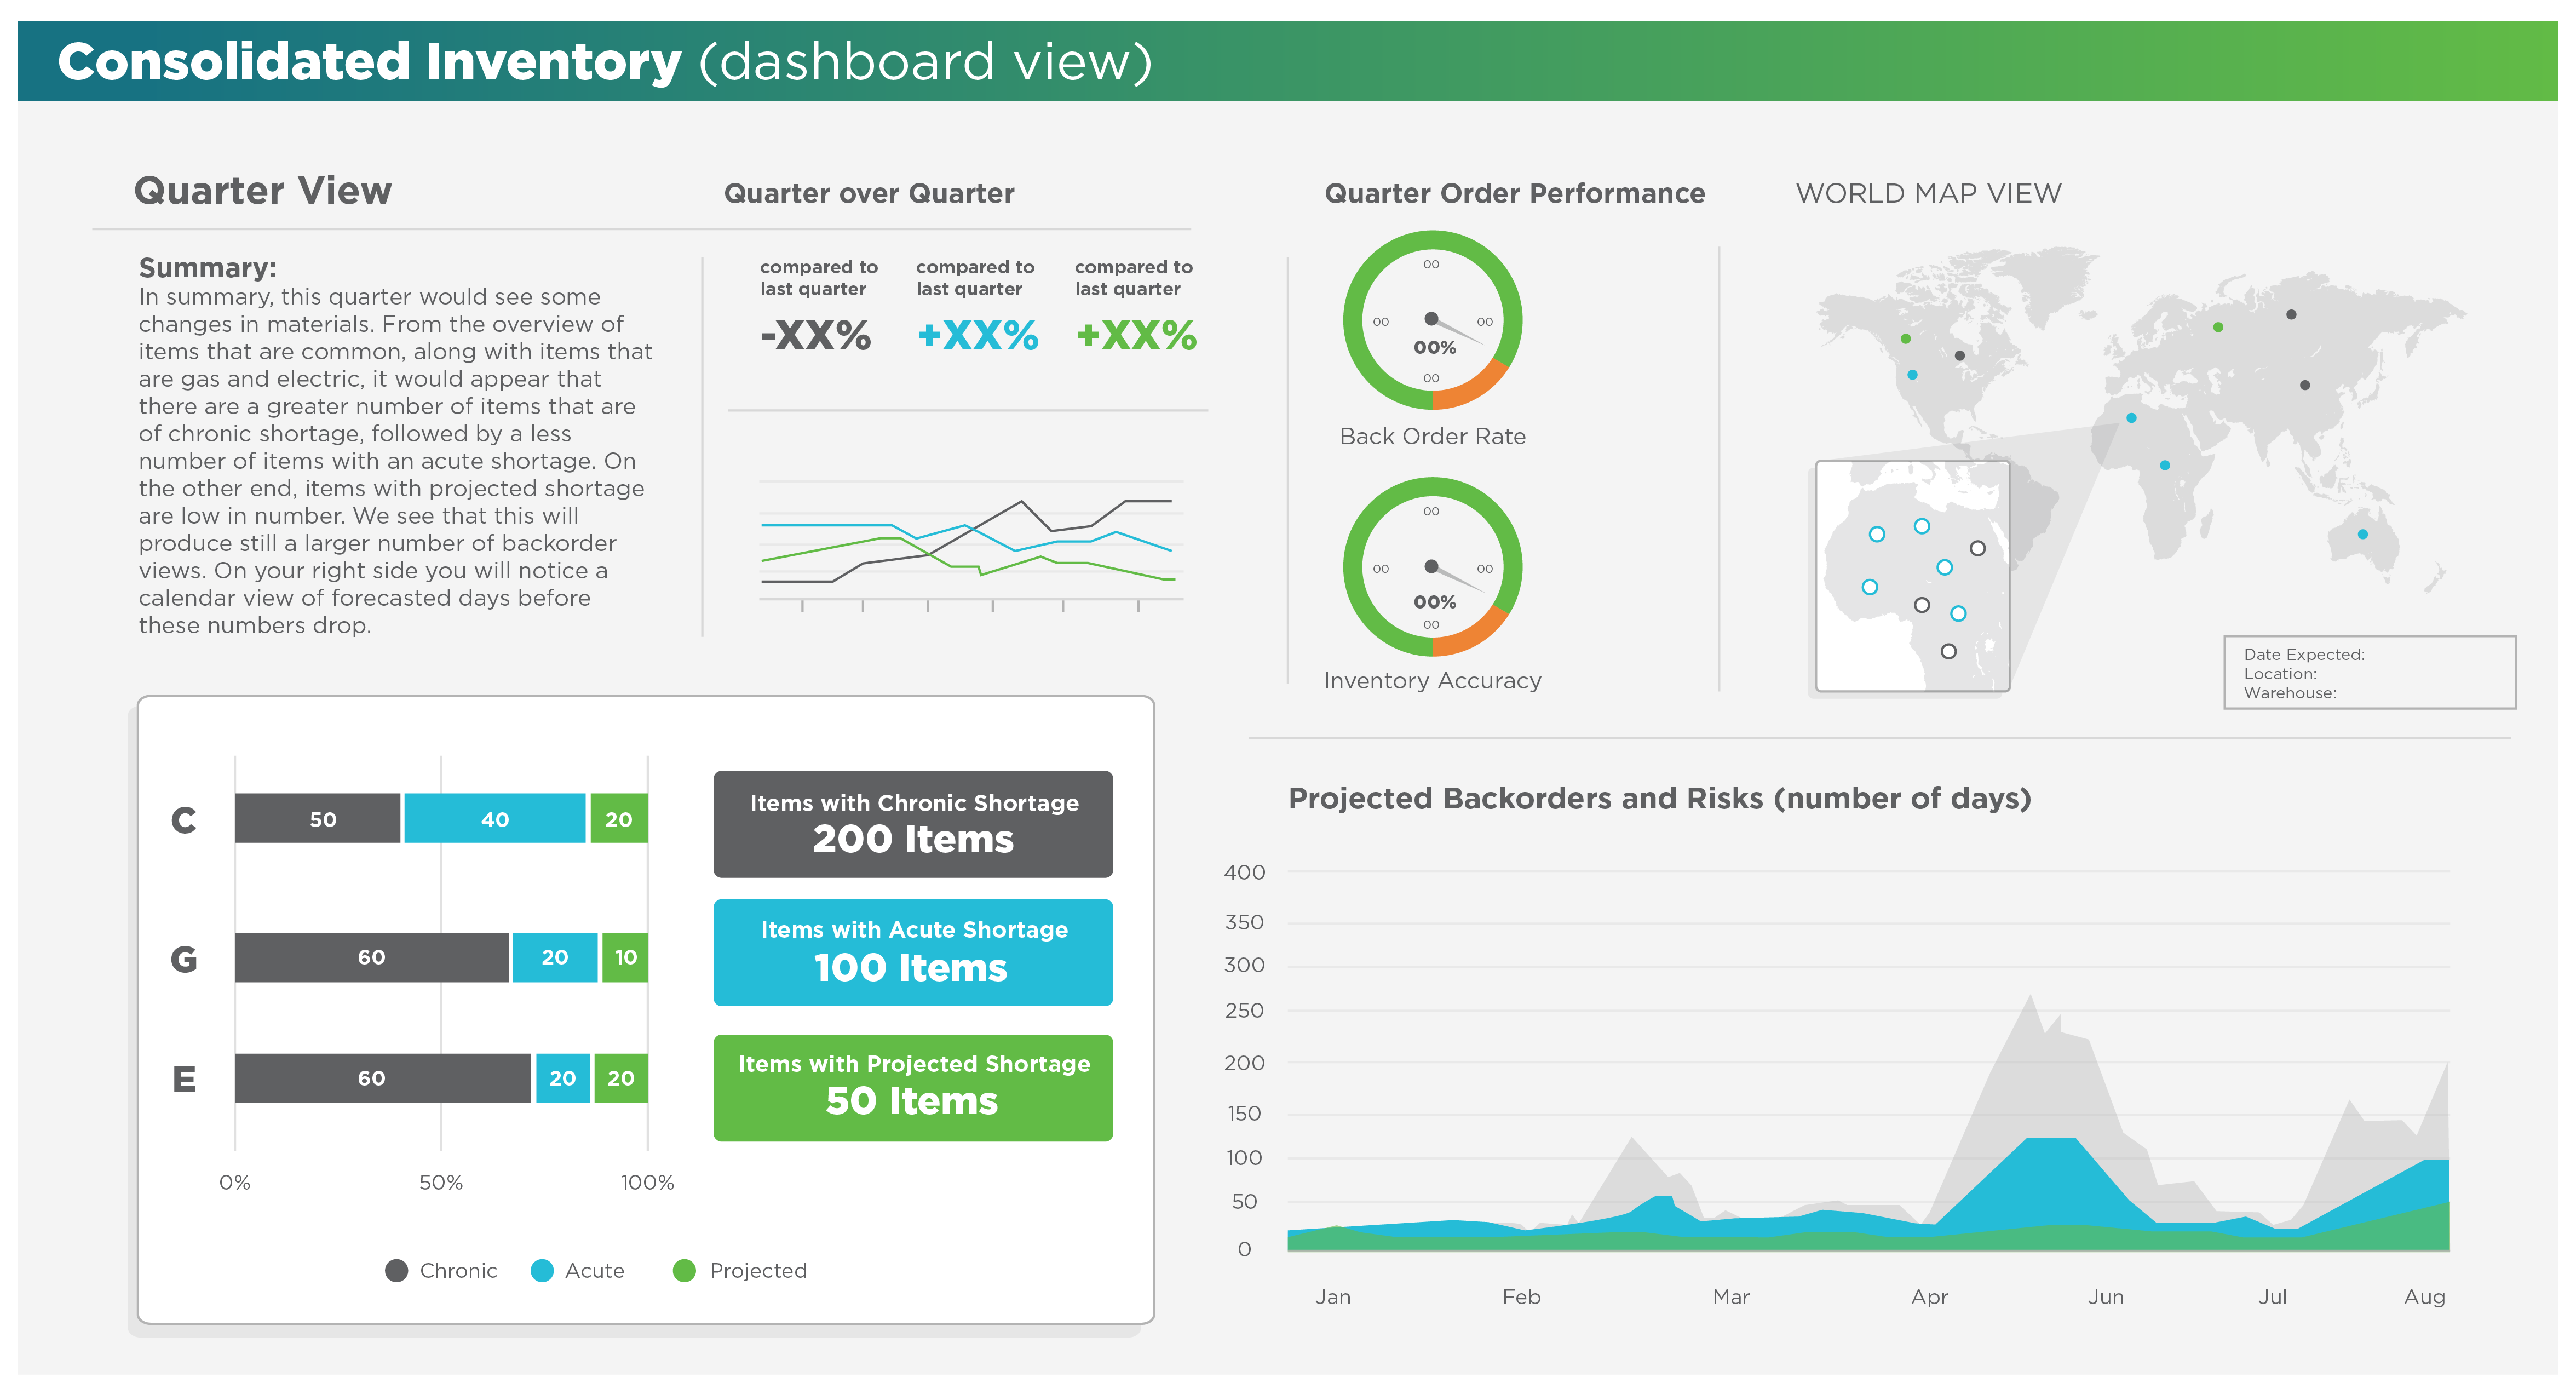
Step Three: Validate Data Outcomes
Data validation ensures that correct inputs are recorded and that the resulting outputs match the desired outputs identified in step one. For example, entering purchase orders, demand forecasts, and lead times yields real-time outputs on the location, material status, and arrival times, as well as the ability to assess supplier reliability, identify jobs at risk of completion, and track optimal supply level trends.
Step Four: Draft Process
In step four, the process for the use of the data outputs is mapped. This process outlines the steps and actions groups need to take based on the output of the supply chain business intelligence model. Step four can run concurrently with step three.
Step Five: Create a Sustainable Governance Model
A sustainable governance model aligns stakeholders with changes, establishes their roles, and determines how changes will be monitored. Performance management is also essential to ensure that both contributors to and users of the business intelligence tools fulfill their responsibilities, especially for activities driven by the tools’ outputs.
Summary
Aggregating data through supply chain business intelligence enables teams to understand which actions are necessary to improve business outcomes efficiently. Through cross-functional and easily digestible dashboards, businesses are positioned for demand planning and can mitigate potential risks in today’s volatile supply chain so that they can have:
- The right materials – work orders, bills of materials, quality assurance
- In the right quantities – service levels, order quantities
- At the right place – which facility or site, where in the facility or at the site
- At the right time – forecasting, demand planning
How ScottMadden Can Help
Events over the last few years have proven how easily the supply chain can be disrupted. The energy industry must rethink standard practices for managing the supply chain. Leveraging our five-step approach, ScottMadden can partner with you to develop a supply chain business intelligence tool that provides the data-driven insights needed to safeguard your supply chain.