

A Discussion of Key Findings from the Latest Finance Shared Services Research Related to Shared Service Locations and Regions Served
In December 2020, ScottMadden’s Brad DeMent and Trey Robinson delivered a webinar to discuss the results of the latest APQC finance shared services benchmarking study. The study was designed by ScottMadden and surveys were administered by APQC over five cycles: Spring/summer 2014; spring/summer 2015; summer/fall 2016; spring/summer 2018; and summer 2020. The scope of the finance shared services study included delivery model, scope of services, staffing, location, performance, and technologies leveraged. Results from 200 organizations from the last two cycles were shared during the webinar.
Drawing from the results of the survey, this article summarizes the study’s findings about global shared service center (SSC) locations and regions served.
Access the complete article series here.
Global Locations
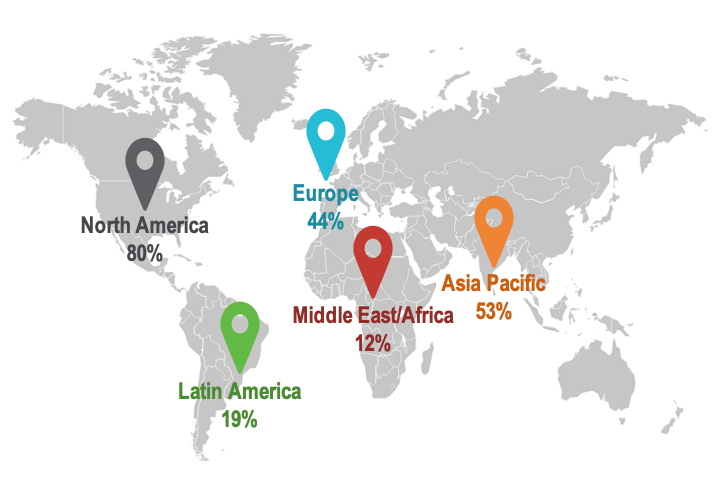
All of the respondents in the last two cycles are located in the United States or Canada, so it’s no surprise to see that a large majority (80 percent) reported having SSCs located in North America, followed by Asia Pacific (53 percent) and Europe (44 percent). A majority of respondents (69 percent) reported having SSCs located in more than one region.
Figure 1: In which regions are your SSCs located?
About two-thirds of respondents also report that their SSCs service more than one country (Figure 2), which DeMent said has been growing as a trend over the last decade or so: “I’ve been with ScottMadden for about 20 years, and for the first 5 to 10 years we were primarily seeing SSCs that serviced only their home country. Now, that’s not the case – organizations have demonstrated the ability to navigate different country laws, regulations, and business cultures and expand services regionally and globally, all while reaping similar benefits of domestic models. The regional and global expansion has also opened eyes to leveraging the best practices in process and automation used in other countries that may have otherwise gone unnoticed.
Figure 2: Number of Countries Served by SSC

Regions Served
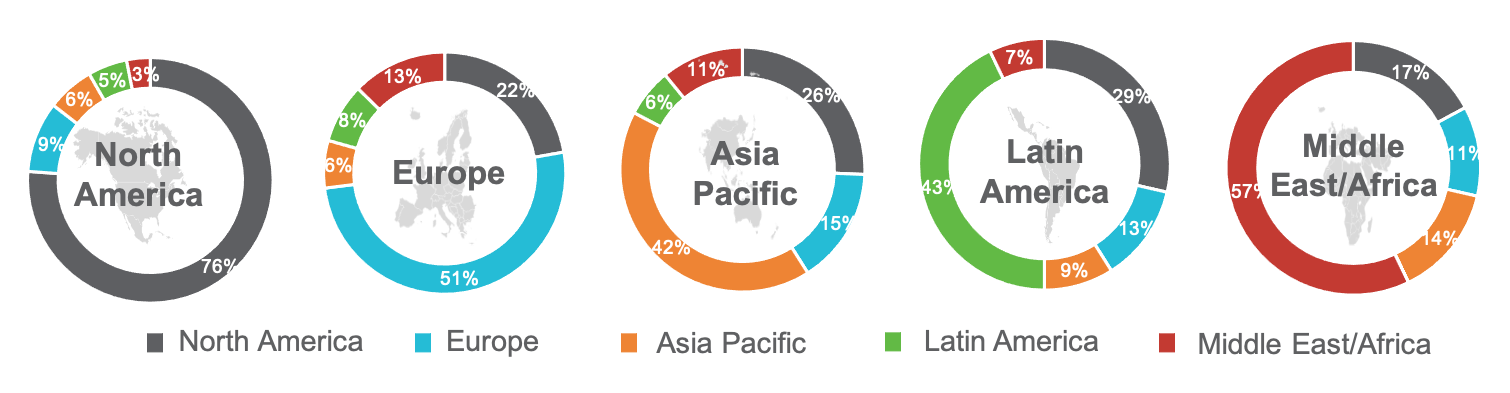
While it is common for organizations to have multiple centers that support global operations, many SSCs located within a particular region tend to provide the most support to the countries located within that region. For example, 76 percent of SSCs located in North America provide services to customers in North America and 57 percent of SSCs in the Middle East/Africa service customers in that region. SSCs within the Asia/Pacific and Latin America regions, meanwhile, service more countries outside those regions than within them (Figure 3). DeMent noted that this is largely because SSCs in these regions can serve customers at a lower cost.
Figure 3: Customer Geographies Served by SSCs in Each Region
Study Demographics
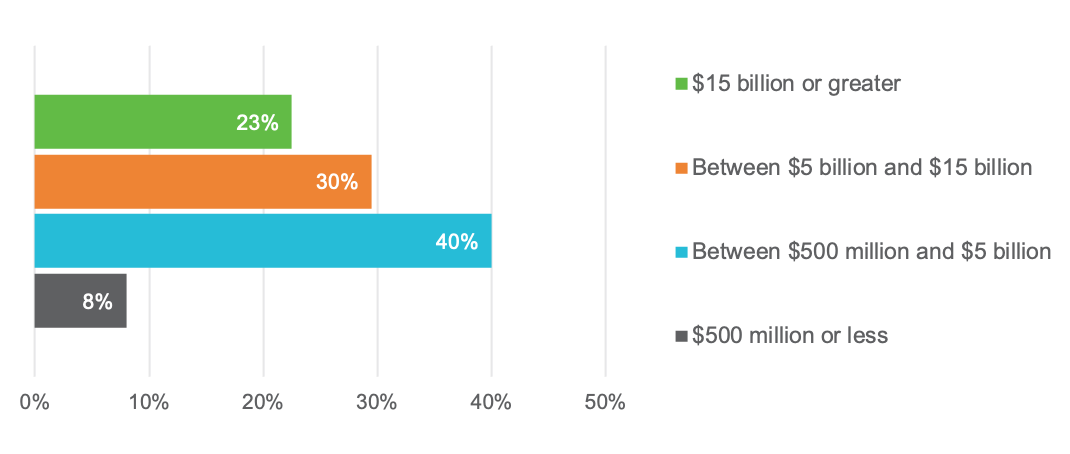
The results summarized represent 200 participating organizations from the US or Canada. Company size is balanced across the revenue profile (Figure 4), with median revenue of $11.9 billion. Most organizations (87 percent) have been operating over three years, and more than half (55 percent) have been operating for over five years.
Study Population: Business Entity Revenue