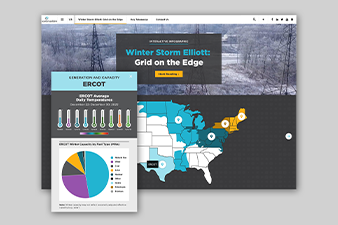
Click the image to open the model.

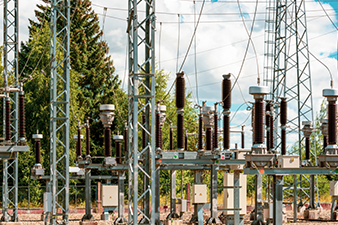
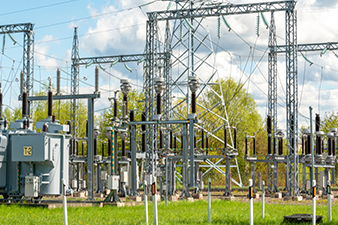
It has been years since discussions of the Texas Electricity Grid grabbed headlines as Winter Storm Uri bore down on Texas. In our debut episode, we introduced the interactive Texas Energy Generation Model, allowing users to choose the energy generation mix for the state of Texas and determine how that portfolio performs compared to electricity demand. The “what-if” analysis capability of this model allows us to discuss outputs and their importance in shaping the electricity generation mix and the future of energy. In this episode, the model uncovers challenges and capacity demands that regulators, utility executives, and customer advocacy groups should consider as coal phases out and renewable energy resources become king.

The Interactive Texas Energy Generation Model
For example, if we run the model in a “carbon-free” energy mix, we see the urgency behind replacing the current frontrunner in Texas generation—natural gas. We can also consider other renewable resources, such as hydroelectric generation, but the long lead times for project development for new hydroelectric generation led us to use it as-is for the model. So, what is the answer?
To make up for the energy shortfall in the “carbon-free” scenario, try doubling the current wind and solar generation resources. The gap between electricity demand and energy produced gets considerably smaller, and we start to see instances of excess energy in the March and April 2021 timeframe. When analyzing the hourly breakdown of energy generation, wind and solar resources produce less energy in the evenings, so another dispatchable resource needs to ramp up and close the demand and supply gap. For example, look at a single day, like November 2, 2020, where there is more than enough output except for a few hours in the afternoon when the electricity output falls short of demand. Under today’s electricity generation mix, the resource making up for the shortfall in electricity supply is typically natural gas “peaker” plants. Utility-scale battery storage energy is one solution, and the possibility of advanced nuclear is another (we will discuss both topics in upcoming episodes).

Now, try a generation portfolio scenario with four times the amount of wind and solar resources. As shown by the model results, the demand, and supply gap decreases—on most days, the demand is met or exceeded. However, there are times when demand falls short of the energy supplied. February (the time of Winter Storm Uri) is not the only instance of a significant demand and supply gap. For example, September 2020 was a time of sustained low winds where ERCOT sent notices asking Texans to consume less electricity.
On most days, the demand is met or exceeded. However, there are times when demand falls short of the energy supplied.
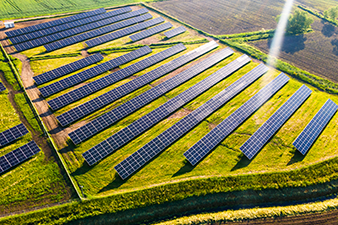
One of the significant challenges with renewable energy development, especially wind, is surface area. When wind and solar resources are quadrupled in the Texas market, the surface area required for that development is equivalent to an additional 111 Washington, DCs or 5,500+ square miles. When deciding where to put a generation facility, factors such as transmission access, grid capacity, resource availability (is it a windy or sunny spot?), and nearby neighbors need to be considered.

The availability of wind and solar (i.e., energy production) will vary each hour. An important aspect of increased solar and wind generation is what the model notes as “excess energy.” In our view, each area of excess energy shown in the model is an opportunity. As more renewable resources become available on the grid, excess energy production can support new and growing electric applications.
Each area of excess energy that shows up on the model is an opportunity.
For instance, co-generation. Why not use the power to generate another resource, such as hydrogen? Another opportunity is diverting it toward mining cryptocurrency. Excess energy can support many other opportunities, such as charging electric cars or fleets. ScottMadden has supported clients with business cases evaluating several of these options.
As we continue to decarbonize the energy industry, one big question sticks out to us: how will we effectively replace natural gas? In our next episode, we will dive into some key implications of relying primarily on natural gas.
How can we help?
- Education Sessions – Educate your leadership team on the considerations and implications of these trends to your service territory.
- Business and Strategic Planning – Supporting your organization’s strategic decisions around changing energy generation mix
- Integrated Resource Planning – Challenge your organization with different considerations to your current integrated resource plan.
- Regulatory Policy and Strategy – Support the development of a regulatory strategy that considers the changes in your planned generation mix
- Grid Modernization – Help you navigate the new grid technologies and their impact on your utility operations and business model.